Facts and Figures
TRU at a Glance 2024–2025

*Indigenous FTEs and headcounts are for the 2023-24 fiscal year due to the one-year delay in receiving system-wide information.
Dually enrolled: Includes learners who were enrolled in at least one course on any TRU campus AND enrolled in at least one Open Learning course in the same fiscal year. Dually enrolled students are included in both the on campus and Open Learning headcounts.
Factbooks
Factbooks give an overview of learners at TRU for a fiscal year (April 1 to March 31). They report course enrolments, student headcount, full-time equivalent enrolment and credentials awarded.

Factbook
Fiscal year
2024-25

Factbook
Fiscal year
2023-24

Factbook
Fiscal year
2022-23

Factbook
Fiscal year
2021-22

Factbook
Fiscal year
2020-21

Factbook
Fiscal year
2019-20

Factbook
Fiscal year
2018-19
Ministry performance measures
Each year, TRU's performance is reported on measures and targets set by the Performance Measures Working Group, a collaboration between BC public post-secondary institutions and the Ministry of Advanced Education and Skills Training. TRU, along with other public post-secondary institutions in BC, is accountable to the ministry and the public for its performance related to ensuring students receive quality educational opportunities relevant to their needs and the needs of the labour market.
The performance results below are calculated for TRU as a whole, including the Kamloops campus, Williams Lake campus, regional centres and Open Learning. Please consult the ministry's Accountability Framework Standards Manual for a full description of each measure. All but one measure has been achieved (100%+), or substantially achieved (90% to 99%).
Ministry accountability strategic objective: Capacity
Operational definition: The number of full-time equivalent (FTE) student enrolments delivered overall and in designated program areas.*
| Student spaces (FTE) | 2019-20 actual | 2020-21 target | 2020-21 actual | Assessment | 2021-22 target | 2022-23 target |
|---|---|---|---|---|---|---|
| Total student spaces | 8,834 | 8,136 | 8,241 | Achieved | 8,118 | 8,121 |
| Nursing and other allied health programs | 1,334 | 824 | 1,357 | Achieved | N/A | N/A |
| Developmental | 275 | 1,357 | 232 | Not achieved | N/A | N/A |
*Open Learning FT divisors have been changed for 2020/21 to align with on campus programs, as per AEST direction.
The developmental — Adult Basic Education (ABE) and English as a Second Language (ESL) — targets were not met because of the challenges with face-to-face training during the pandemic and resulting lack of demand.
Note: Results are based on fiscal year; excludes Industry Training Authority (ITA) funded student spaces.
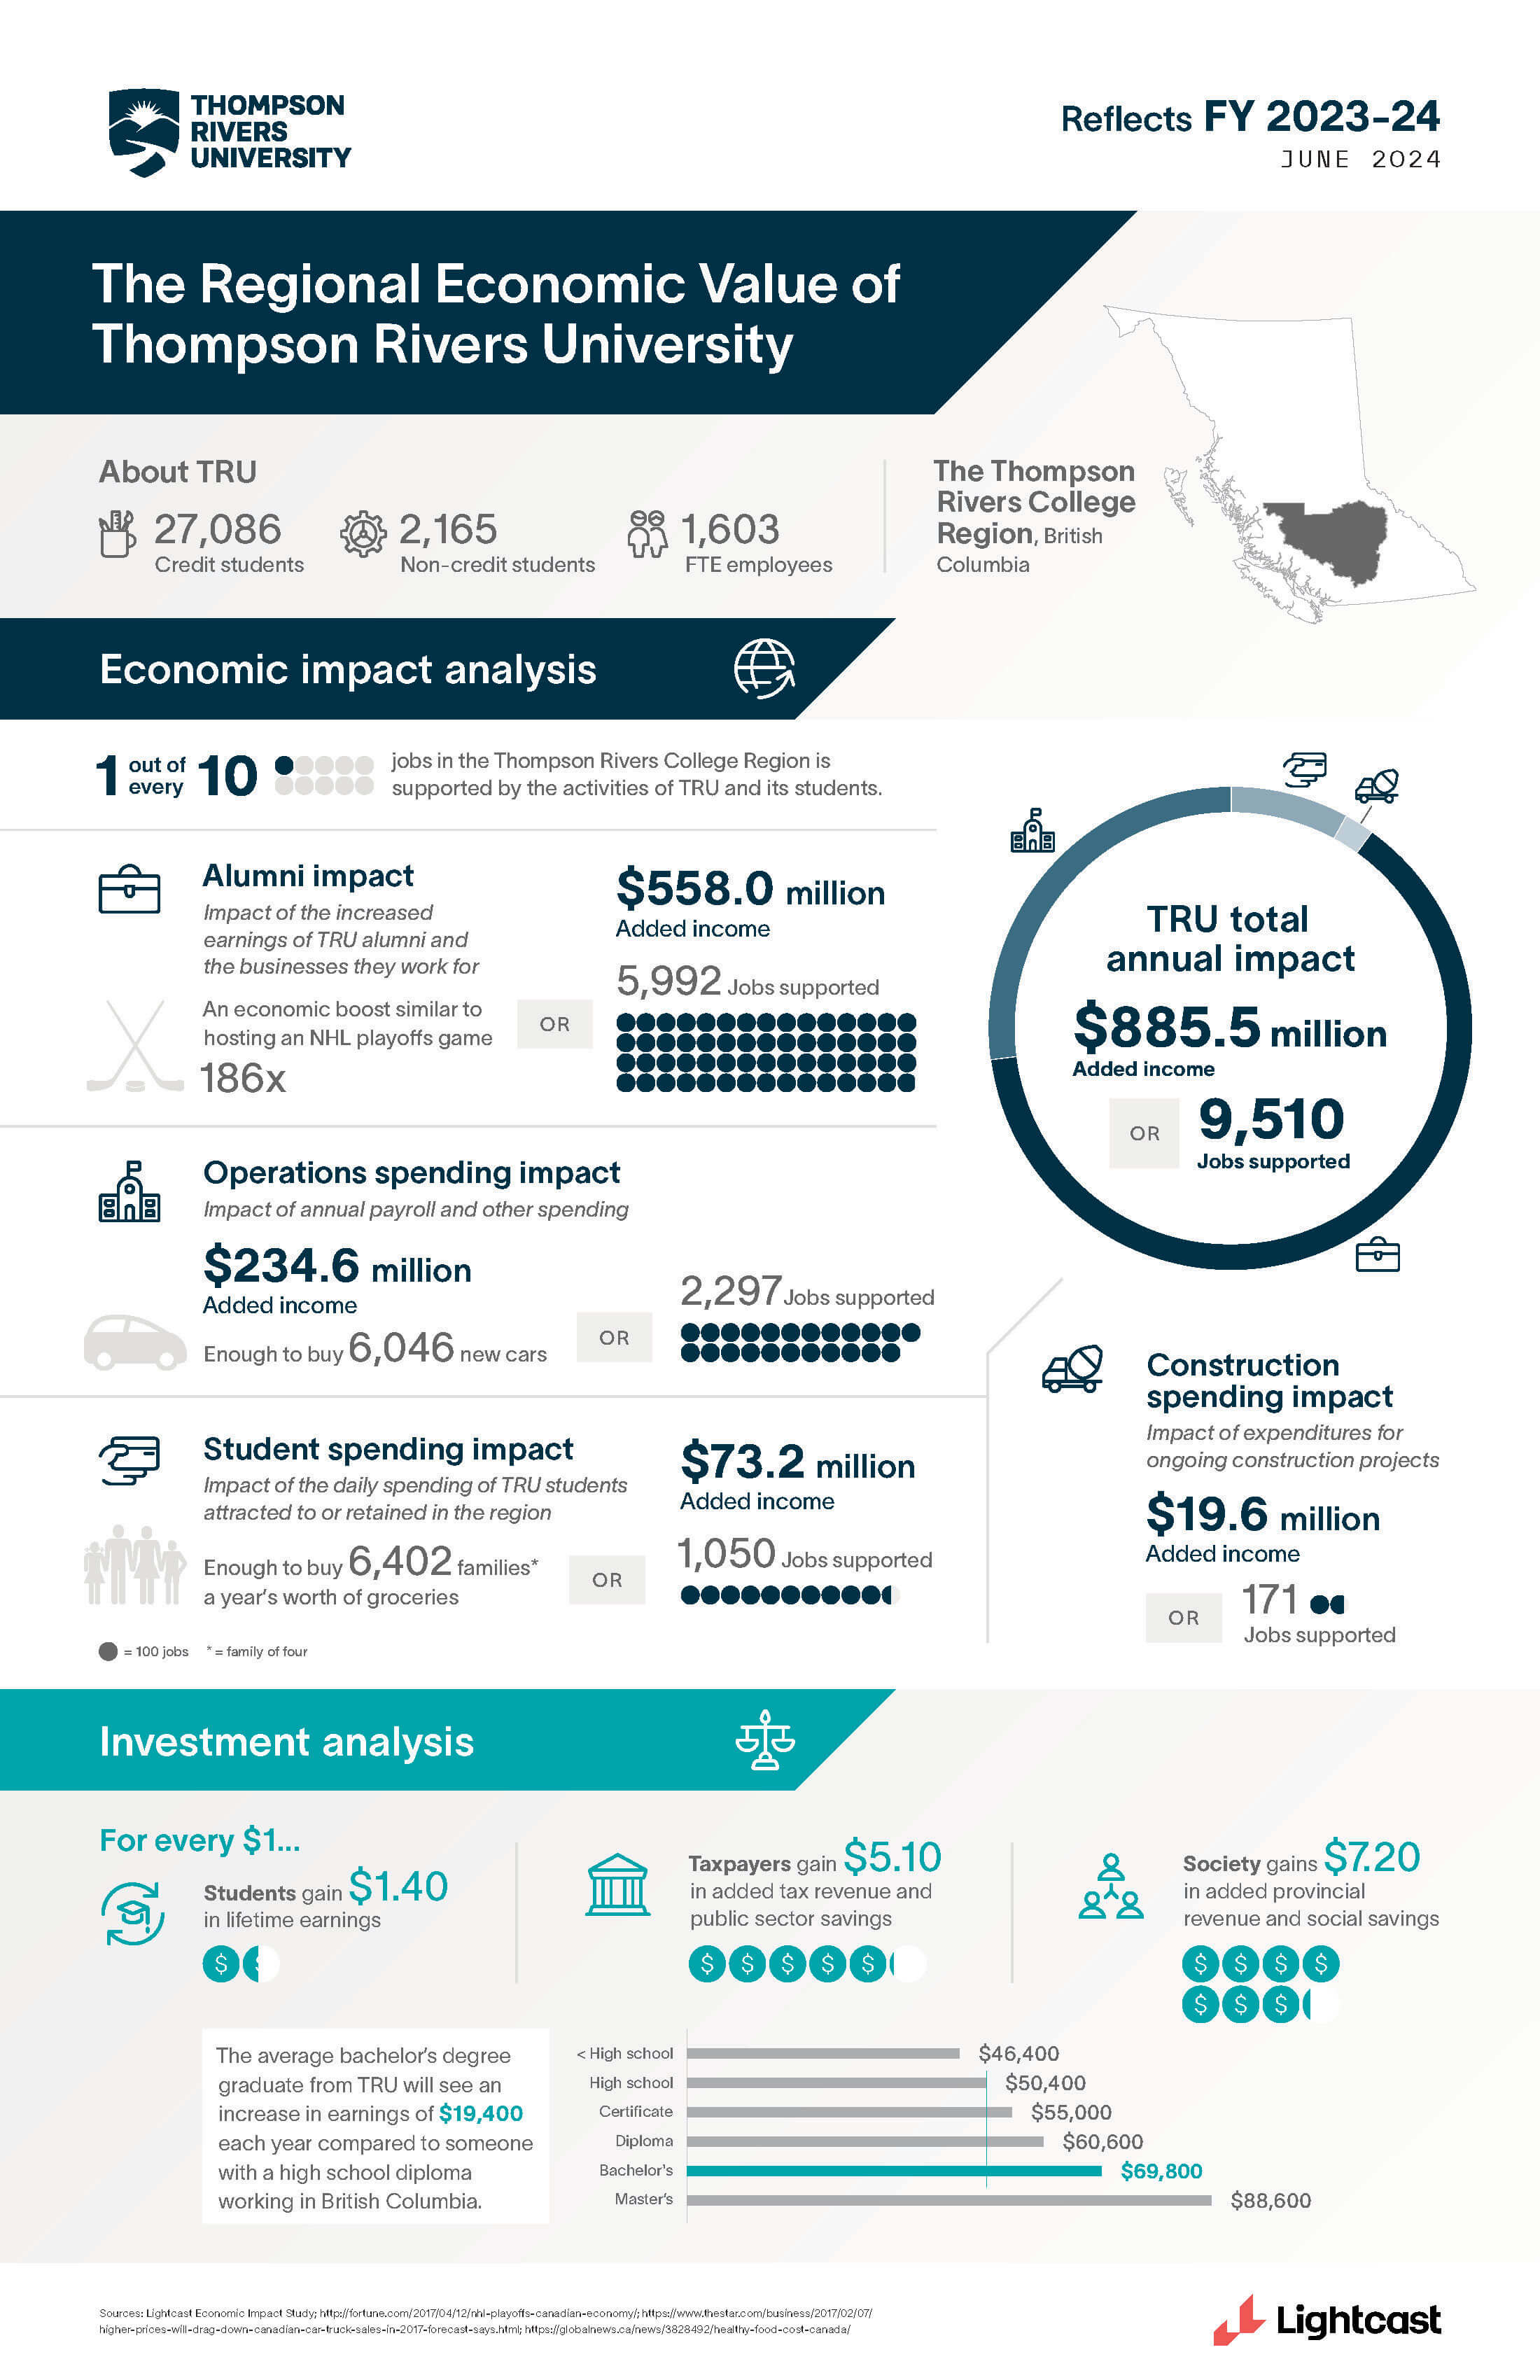
The economic impact of TRU
The results of TRU’s latest economic impact study indicate one in every 10 jobs in the Thompson, Nicola and Cariboo region, and one in 140 jobs in the province is supported by the activities of TRU and its students.
TRU engaged Lightcast, a labour market analytics firm, to assess the economic impact of TRU to the region and the province it primarily serves. Overall, the analysis, which was based on data from the 2023-24 fiscal year, found that TRU positively influences the lives of its students, as well as the regional and provincial economies.

